
Data Science for Beginners
Data science is a very popular term and a sensation that attracts every technology enthusiast now a days. There are several courses available to introduce people to data science. However, the fundamental principal is extremely simple.
Data Science is an umbrella which covers
- Data Analytics & Business Intelligence
- Business Analytics
- Deep Learning
- Natural Language Processing
- Data Engineering and
- Many other related terms
It is not simple to master every field coming under this umbrella, yet it is important to understand the basics of each field. This article provides an overview of the field of Data Analytics and Business Intelligence. Further in the series we will be exploring other fields before diving deeper into Data Science. The aim is to provide basic understanding to data enthusiasts in order to enable them to choose the field they would like to excel in.
What is Data Analytics & Business Intelligence?
Data Analytics in ‘simple terms’ is modifying the raw data into a meaningful format for better analysis whereas Business Intelligence provides support in decision making and helping the organizations to grow their business.

Photo by import.io
At this stage, it is expected to have a lot of questions like
- What are the steps involved in Data Analytics and Business Intelligence?
- What to do first and what to do next?
- What do you need to become a good Data and Business Intelligence Analyst?
We will be looking into each of these questions into some details.
Steps involved in Data Analytics and Business Intelligence:
1. Understand the business function:
This is the first step of Data analytics. The sole aim of this step is to get better clarity on how the business operates and the problem we are trying to solve. In this step you will be asking a lot of questions to gain as much clarity as possible. Be mindful of the fact that this step will be time consuming and help you build the foundation of your project.

Photo by PNAS
2.Get your data:
Once you have clearly defined the problem statement, you must start collecting the data. This data can be in any format like text, csv, pdf, excel, tables. Getting expected data in tabular format is extremely rare and the most desirable.

Photo by Stanford
3.Create a copy of original data and perform your steps on the copy only:
This is a very basic step and an extremely crucial one, ensure to make a copy of your original data. This helps you in more than one way. In case of any mistake there is always an option to fall back on.
4.Perform ETL (Extract, Transform & Load) and clean the data.
ETL stands for “Extract, Transform, and Load.” The process of ETL plays a key role in data integration. ETL allows businesses to gather data from multiple sources and consolidate it into a single, centralized location and makes it possible for different types of data to work together. You should perform Data Cleansing to detect and remove corrupt or inaccurate records from a set of data. Some examples of Data Cleansing include getting rid of extra spaces, converting numbers stored as text into numbers, removing duplicates, changing text to proper case etc.
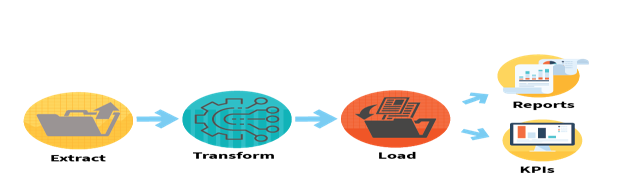
Photo by Era Environmental
5.Start with descriptive statistics first.
As the name suggests, descriptive statistics are used to describe the basic features of the data in a study. They provide a simple summary of the sample and the measures. This gives you a good understanding about the dataset available with you for analysis.

Photo by Lynda.com
6.Enrich your data to get the maximum value out of it.
Data enrichment is a general term that applies to the process of enhancing, refining, and improving raw data. If required, do some data enrichment to enhance the dataset. For example, extract various components from date column such as month, quarter, day etc.
7.Build helpful visualizations.
Once your data is fully prepared and ready, start using some BI tools such as Power BI, Tableau or Qlik to build visualizations. It is a graphical representation of information and data. You can use charts, graphs, and maps to see and understand trends, outliers, and patterns in data.

Photo by PCmag
8.Build models to figure out the trends that were not recognized in visualizations.
You need to create different machine learning models to understand the patterns which are not present in the visualizations created above. This is a vast topic which we will cover in subsequent articles. But to give you a glimpse, basic visualizations helps you to understand the past trends whereas Machine Learning models help you to derive what can happen in future.
9.Fee your model with new data every time to make it more and more effective.
You should feed the model with new data and keep fine-tuning it in a periodic manner to enhance the predictability of it. Always remember , Your model is not a one-time thing.it will degrade with time and you must frequently feed it with new data points to maintain its accuracy.
What do you need to become a good Data and Business Intelligence Analyst?
- Understanding of data and data analysis capabilities
- Problem-solving approach
- Domain-specific knowledge.
- Good communication skills.
- Attention to detail.
- Knowledge of any BI tool (such as Power BI, Tableau, Qlik)
To conclude, these are the basic steps for Data Analytics and if you perform the steps given here, you will start experiencing the power of Data and Analytics. I wish you all the luck and urge you to start your data journey as soon as possible.
Remember, an article can give you the basic knowledge only, practice and only practice will make you perfect.
In the next article, I will explain one of the most popular BI tools in the industry, POWER BI.
Stay tuned!!
Author: Vaishnav Mishra, Manager (Data Analytics & Business Intelligence)
Four Easy Steps to Get Subscribed
Step1:-Enter your Email address and Hit SUBSCRIBE Button.
Step2:-Please check inbox and open the email with the subject line“Confirm your subscription for Global PLM“.
Step3:-Please click “Confirm Follow” and you got the email with the subject” Confirmed subscription to posts on Global PLM”.
Step4:-Voila, You are subscribed.Happy Learning
We will more post on Data Science in upcoming days.
Kindly provide your valuable comment on the below Comment section and We will try to provide the best workaround.
Kindly subscribe to your Email-Id at (http://globalplm.com/) and drop any suggestions/queries to ([email protected]).