
Exploratory Data Analysis (EDA)
In the previous article, we saw what are Data Analytics & Business Intelligence and what are steps involved in them. In this article, we will dive a little deeper and try to understand one of the major steps in Data analysis, the EDA.
So, what do you think when you read the term ‘Exploratory’, it sounds like exploring something, right? Exploratory Data Analysis or EDA does exactly that. It explores the given data and summarizes its important characteristics.
What is the meaning of EDA?
EDA is the first step in any Data Analytics project. It helps the Data Analyst or data scientist to visualize, summarize, and then interpret the hidden information in the data. Once EDA gets completed, its features can be used for machine learning models.
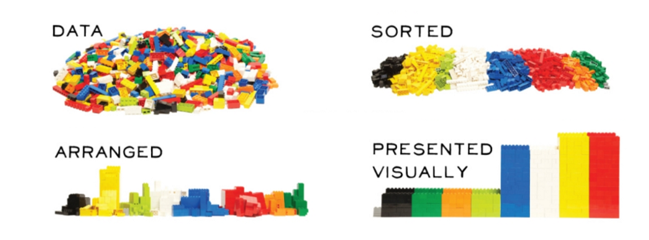
Source: Medium
What we do in EDA:
- Get data: We start with collecting the data. This data can be in any format like text, CSV, pdf, excel, tables. Getting expected data in tabular format is extremely rare and the most desirable.
- Inspect the data: We understand the data, its dimensions, its shape, and all other aspects by inspecting it thoroughly.
- Data cleaning: We identify the data types, fix the rows and columns, treat the missing values in rows and columns, handle the outliers, standardize and fix the column and row values and filter the data if needed.
- Perform univariate, bivariate, and multivariate analysis: We perform every possible data analysis to understand any important trend in the data. Univariate is the analysis of one variable, Bivariate is the analysis of two variables and Multivariate is the analysis of more than two variables.
- Derive insights: Once the EDA is complete it is time to derive useful insights from the data.
Data Science for Beginners Part-1
Steps of EDA:
1.Understanding of data, variables and data types
This is our first step in the EDA process. Before diving into actual EDA, we will understand our dataset first. We will check the shape (number of rows and columns) and gather information about any discrepancy in the dataset.
After this, we will identify the types of variables in the dataset. Variables in the dataset can be of two types:
Numerical and can be further classified into Discrete and Continuous
Categorical and can be further classified into Ordinal and Nominal.
In the last step, we will identify the input and output variables. By input, we mean Predictor columns and by Output, we mean Target column.
2.Basic Data Cleaning:
Next, we will perform the basic cleaning of our dataset. Basic data cleaning includes:
- Removing duplicate values.
- Removing redundant variables.
- Assigning proper data type to the variables
- Doing the name correction of columns
- Removing all possible garbage values from the dataset.
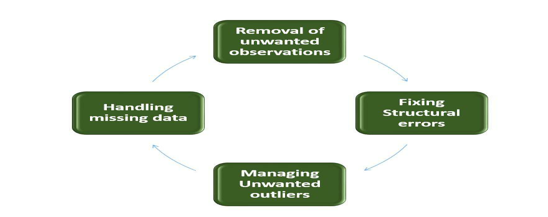
Source: geekforgeeks
3.Advanced-Data Cleaning:
Advanced data cleaning includes many techniques and two of the most important techniques are:
a.Missing Value treatment.
Missing data is the data that is not stored or not available in the observation. We deal with the missing data depending on what data is missing:
- If the number of missing values is very less, then drop the missing values
- In the case of numerical columns, we can impute the missing values with the mean value of that column. It is necessary to check that the column does not have extreme values, otherwise it will create issues with proper imputation.
- In the case of extreme values present in the numerical column, we can always impute the missing values with the median values of the numerical column.
- In case of categorical column, we can use mode of the categorical column to impute the missing values
- We can also treat the missing values as separate categories.
Missing value treatment is a good practice, but we should always keep in mind that this process should not impact the dataset and we do not face loss of information.
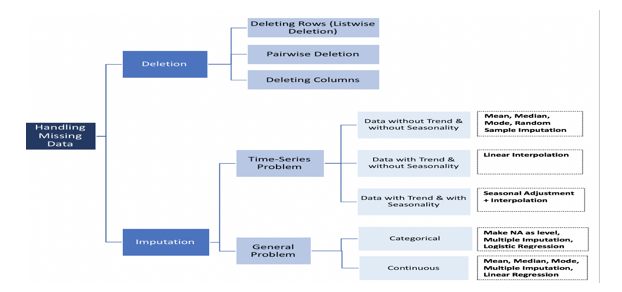
Source: towardsdatascience
b.Outlier treatment
Outliers are extreme values in the dataset. They fall way beyond (abnormal distance) other observations in a variable.
We should always try to understand the importance of these outliers before treating them. They can give very insightful information about the problem at hand and the subject area.
We generally manage the outliers by:
- Dropping the values of outliers.
- Using the median to replace the outlier values.
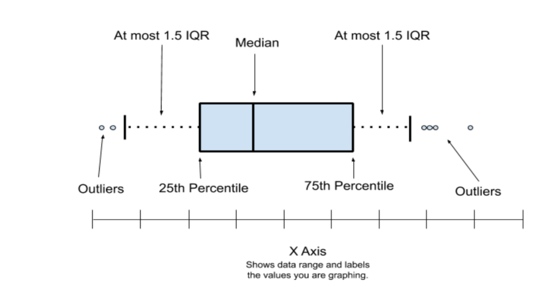
Source: publiclab
4.Univariate Analysis
Univariate analysis is the analysis of a single variable at a time. It is very important to look at and understand every variable and perform an analysis of it.
We can use different types of Charts to perform the univariate analysis.
Some of the useful charts are:
Histogram: It gives us useful information about the data i.e. data is normally distributed, or it is skewed to the left or right.
Box Plots: It gives us a statistical summary such as Minimum, Maximum, Median, and 1st, 2nd, and 3rd Quartile.
Count Plots: It is used to understand the frequency of every category of the variable.

Source: allaboutdatascience
5.Bivariate Analysis
Bivariate analysis is the analysis of two variables (numerical-numerical, categorical-numerical, and categorical-categorical) at a time.
We can use different types of Charts to perform the bivariate analysis.
Some of the useful charts are:
Scatterplot, Line Plot, Heat map: We use these graphs in case we want to analyze two numerical variables.
Bar Chart, Categorical Box plot: We use these graphs in case we want to analyze one categorical and one numerical variable.
Bar Chart, Grouped Bar Chart: We use these graphs in case we want to analyze two categorical variables.
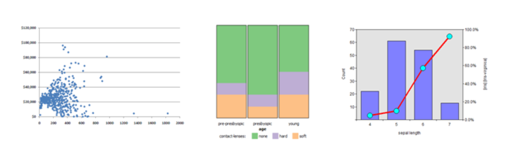
Source: saedsayad.com
6.Multivariate Analysis
Multivariate analysis is the analysis of more than two variables at a time. It gives a realistic conclusion about the dataset since it takes care of more than one input variable that can impact the variability of output.
The multivariate analysis describes the correlation among input variables.
We can use different types of Charts to perform the multivariate analysis.
Some of the useful charts are:
- Pair plot
- 3D scatter plot
- Heat Map
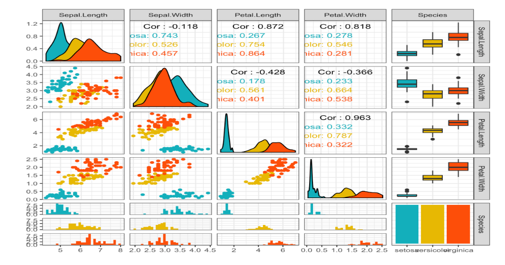
Source: sthda.com
7.Get Final Insights
After all the steps of EDA, we can draw insights from the data. EDA is basically the technique that we can use to discover the hidden pattern in the data and get better results for our problem at hand.

Source: inman.com
8.Dimensionality Reduction
This is an additional step if we are going to move ahead with modelling and make some prediction based on the data. Dimensionality reduction reduces the number of dimensions (columns/independent variables) in our dataset as many input variables can be very difficult to handle while making a predictive model. We will understand this technique in detail in one of our upcoming articles.
To conclude, EDA is very specific to each problem. We must understand the problem first and then start our EDA on the dataset.
With EDA we are not creating any other report, but we are understanding the problem. We do not need to perform any advanced statistical approach or methods to explore the data, we can always keep it simple and get most of the assumptions about our data.
The output of EDA is what we will use as input for our Machine learning models.
In the next few articles, we will try to understand some of the popular machine learning algorithms (Supervised and Unsupervised).
Author: Vaishnav Mishra (Data Analytics & Business Intelligence Leader)
Email: [email protected]
LinkedIn: https://www.linkedin.com/in/vaishnav-mishra-39222b8a
Four Easy Steps to Get Subscribed
Step1:-Enter your Email address and Hit SUBSCRIBE Button.
Step2:-Please check inbox and open the email with the subject line“Confirm your subscription for Global PLM“.
Step3:-Please click “Confirm Follow” and you got the email with the subject” Confirmed subscription to posts on Global PLM”.
Step4:-Voila, You are subscribed.Happy Learning
We will more post on Data Science in upcoming days.
Kindly provide your valuable comment on the below Comment section and We will try to provide the best workaround.
Kindly subscribe to your Email-Id at (http://globalplm.com/) and drop any suggestions/queries to ([email protected]).